Welcome to
AD Scientific Index 2025
World Scientist and University Rankings
Welcome to AD Scientific Index 2025
World Scientist and University Rankings
In the 2025 version, we have expanded our academic data coverage, enhanced our data analysis tools, and added numerous new features to improve the user experience. Seven new rankings: Social Sciences & Humanities Rankings and Art & Humanities Rankings, both at institutional and individual ( H-Index, i10 Index, Citations) levels, along with Under 30 Years Young University/Institution Rankings
24,297 institutions and 2,395,088 scientists across 220 countries in 13 major academic fields and 197 disciplines.


Rankings and Analysis 2025
"Discover new horizons that spark your curiosity and contribute to your personal and institutional growth."


University Rankings
University Rankings
All Institutions Rankings
University Subject Rankings
Young Universities Rankings
University H Index Rankings
University i10 Index Rankings
University Citation Rankings
Top 100 Institutions
Social Sciences and Humanities University Rankings
Art & Humanities University Rankings
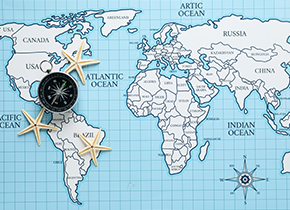
Country & Regional Performance Rankings
Country Rankings
Country Reports
Country Scientist Subject Rankings
Country University Subject Rankings
ASEAN Rankings
Arab League Rankings
EECA Rankings
BRICS Rankings


More Than a Ranking
The AD Scientific Index offers Comprehensive, Distinct, and In-Depth Analyses, ensuring a thorough and nuanced evaluation of academic contributions across various disciplines.


Access Exclusive Insights and Strategic Advantages
Premium Membership
13 Subjects and 197 Fields
Classifications made with an approach tailored to main disciplines and departments, ensuring detailed and accurate evaluation of academic performance.


 Customized Solutions for Success
Empowering Institutions and Individuals
Enhance your academic performance with tailored
solutions. Whether you're seeking bulk registrations for your team or aiming to boost
your individual profile, our plans offer unmatched benefits.
Maximize your potential and access premium features today!

 Country Rankings
Country and Regional Rankings 2025
You'll find something to spark your curiosity and enhance